
Home / Case Studies
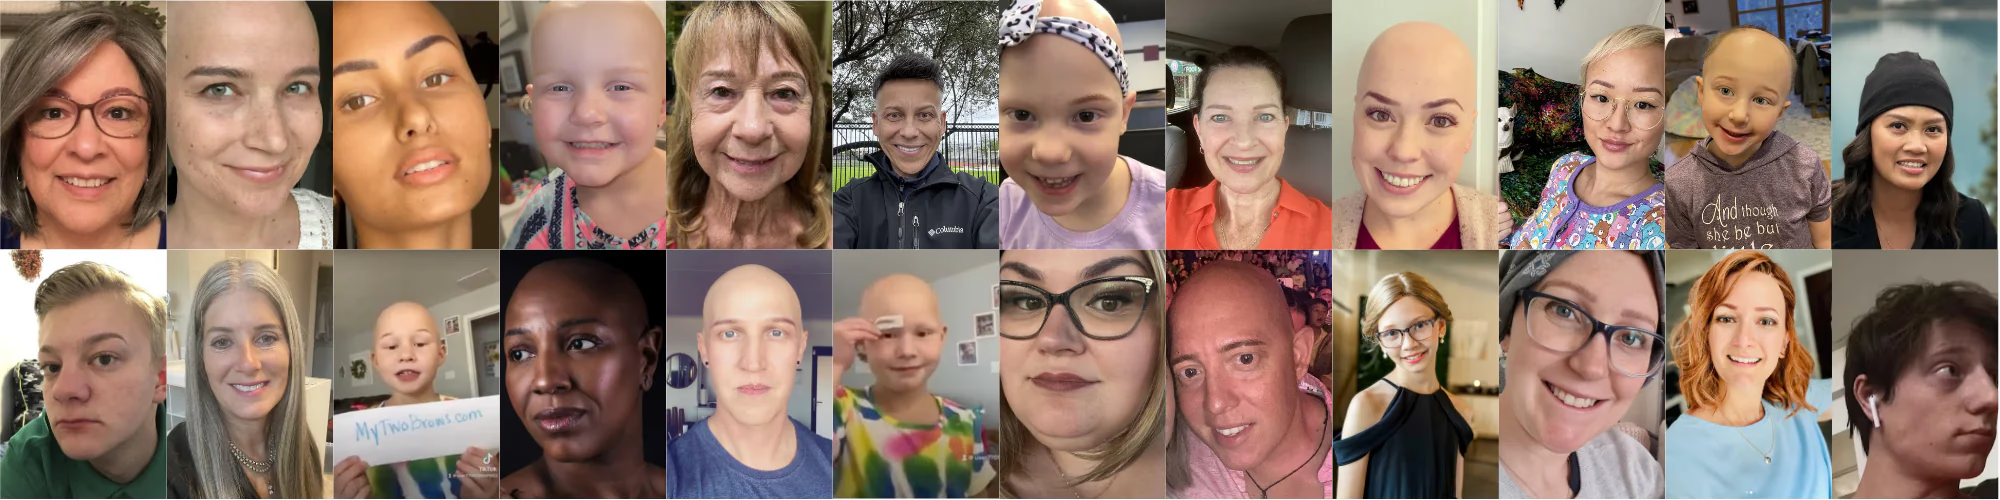
My Two Brows was built from a very real personal problem. Jason Berndt lost all his hair, including eyebrows and eyelashes, after being diagnosed with Alopecia Universalis during military training and aerospace engineering studies. The hardest part was not being bald. It was having no eyebrows. After years of trying pencils and eyebrow wigs that looks unnatural, smeared, or fell off at the worst times, Jason used his engineering mindset to create a solution that actually held up in real life. Pool, gym, sauna, skiing. The brows stayed put. That moment of finally looking like himself again became the start of My Two Brows. Since launching, the brand has shipped more than 20,000 orders and over 1,000,000 sets worldwide, serving people dealing with eyebrow loss from Alopecia, chemo, trichotillomania, and other conditions.

Increase in Traffic

Targeted Keywords PPC
The brand was already selling on Amazon, but the listings needed deeper optimization so they could rank for the right search terms and convert more of the traffic they were receiving.
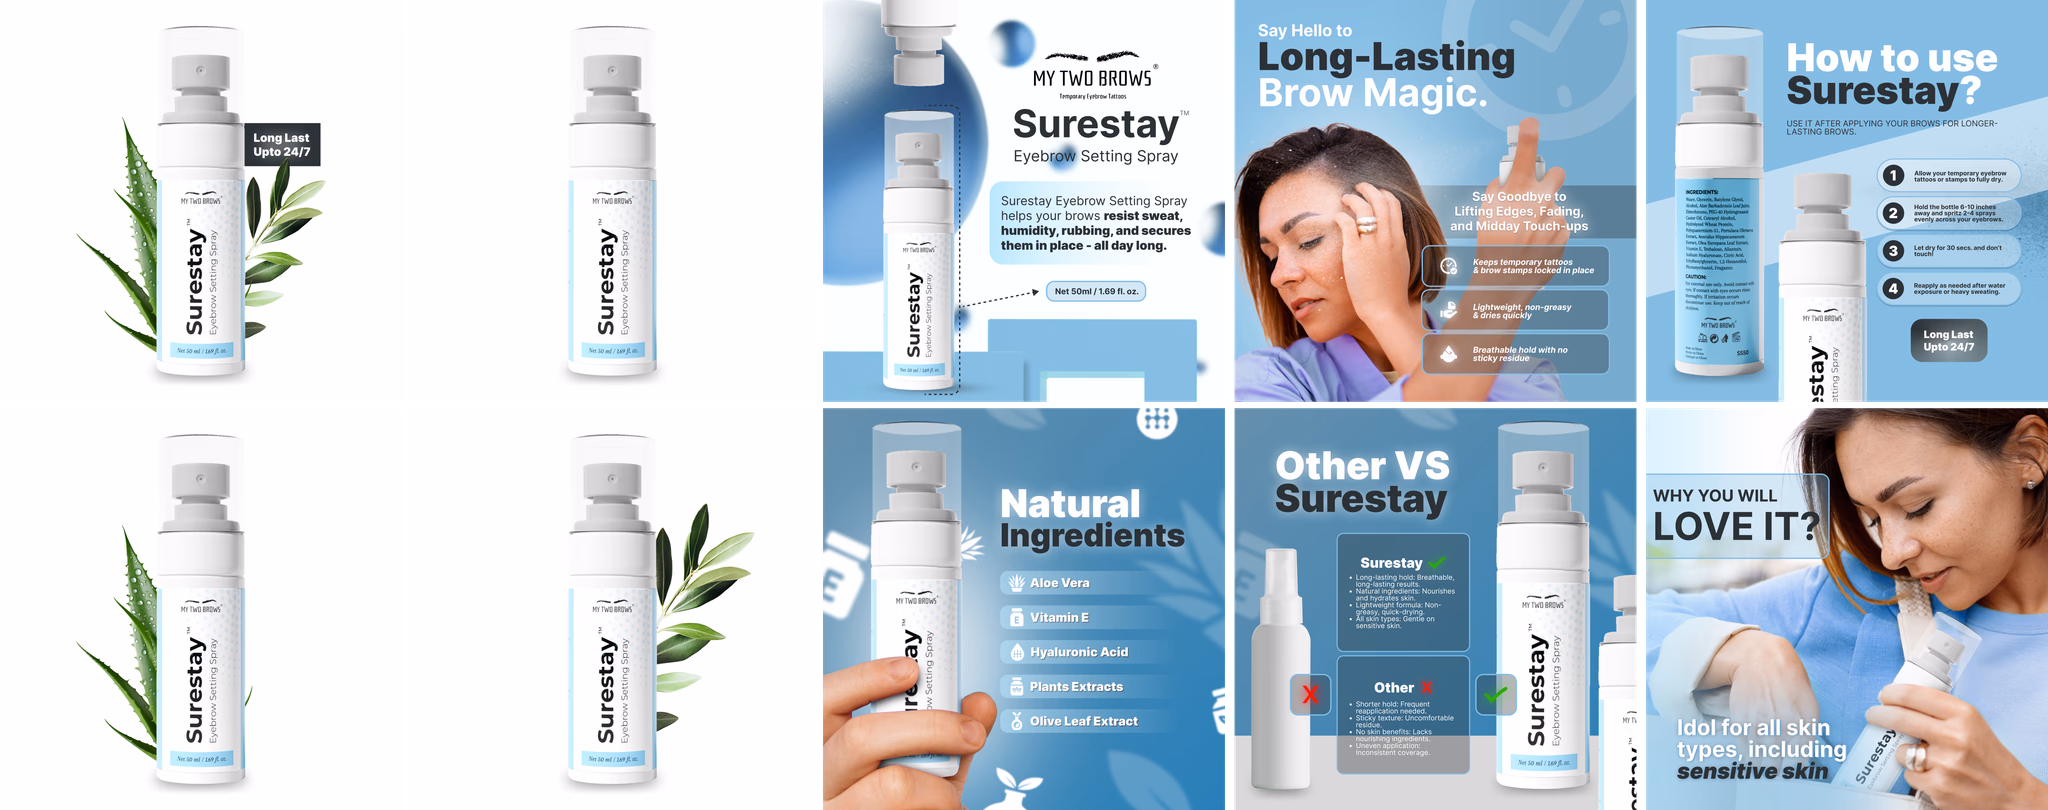
The creative assets on the listings needed improvement in a way that matched Amazon best practices, clearly showed how the product works, and answered key buyer questions quickly.
The brand also wanted to expand into new products, so the next step was validating the market first to confirm demand, competition, and positioning before moving into a full launch plan.
Lastly, some negative reviews were coming from shoppers who were not the ideal customer for this product. People who already had brows expected a different experience
Despite inventory challenges including stockouts of their hero product, we successfully transformed the account from operating at a loss to achieving profitability. The brand now operates on a scalable, data-driven foundation with restored account health and optimized performance across all metrics.
Content and SEO optimization
Creative rebuild from scratch
Fixing the negative review loop
New Product Research
Ads optimization and scaling
We fixed the core content structure so the listing communicated the right promise, the right user, and the right outcomes. This included cleaning up the messaging, improving keyword targeting, and aligning front-end and back-end optimization so the listing could attract shoppers who were actually a fit.
We conducted thorough keyword research and competitor analysis to identify the most relevant and high search volume keywords for our product. Based upon the research, we created listing copies that align with Amazon’s guidelines. These optimized listing copies will incorporate the identified keywords strategically across various elements of the listing, including the title, bullet points, product description, backend search terms, and the alt text of Amazon listing images. This approach ensures that every part of the listing is fully optimized for maximum visibility and searchability.
Listing images redesigned for clarity and conversion
A+ Content built to tell the founder story and explain use cases
Brand Story added to reinforce trust and differentiation
Storefront created to guide shoppers, answer objections, and increase confidence before purchase
We validated product expansion opportunities first, then launched a complementary product that made the core product work even better. The Sure Stay Spray was introduced strategically to improve longevity and increase average order value, while keeping the brand’s promise consistent.
June started as a clean baseline. Traffic quality was strong, and ad efficiency was healthy. With 24,250 impressions and a 1.12% CTR, the account converted well at 9.93% CVR. That efficiency showed up clearly in the numbers: ACoS was 24.32%, ROAS was 4.11, and TACOS was 7.32%. Paid sales made up 30.08% of total revenue, which meant organic was carrying most of the business at 69.92%.
Then July and August became the “scale phase.” Visibility exploded. Impressions jumped from 24,250 in June to 332,999 in July, then to 647,467 in August. Total sales grew with that scale, reaching $10,018.53 in August. But the growth came with a clear tradeoff: the traffic mix got broader and less efficient. CTR dropped to 0.55% in July and only slightly recovered to 0.62% in August.
September shows the first signs of control coming back without sacrificing volume. Even though impressions dropped to 341,997, clicks stayed strong at 3,851 and CTR rebounded to 1.13%. That tells us relevance improved, meaning the ads were being shown to a more aligned audience. CPC eased from $0.92 to $0.88, and total sales still increased slightly to $10,332.07. Organic sales also stepped up meaningfully to $4,144.54, and organic share improved from 34.00% to 40.11%.
Total Sales up +436% (June to September) $1,927.06 to $10,332.07
Total Orders up +436% (June to September) 99 to 531
Organic momentum – Organic Sales up +22% (August to September) $3,406.67 to $4,144.54
Efficiency and control signals CTR up +82% (August to September) 0.62% to 1.13%
Get exclusive insights, trends, and strategies delivered straight to your inbox. Subscribe now!